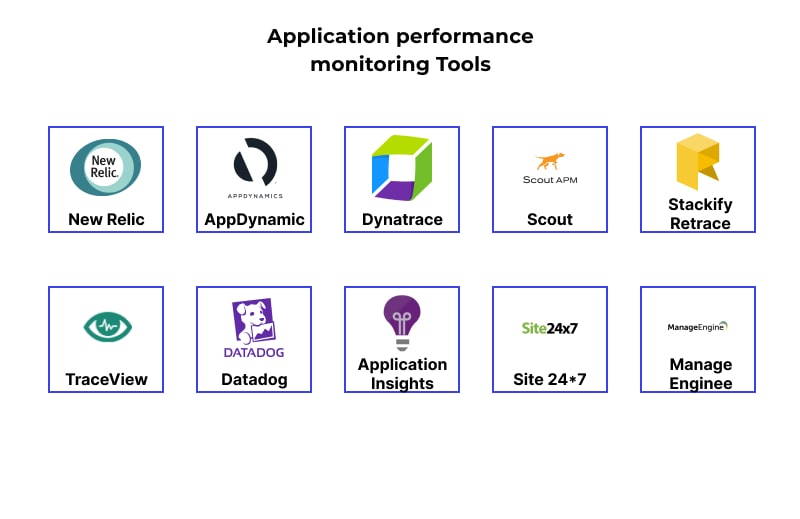
Application Monitoring
Application monitoring is the process of tracking and analyzing software performance and incidents to ensure stability and optimal operations.
Application Monitoring
Application monitoring is the continuous tracking and analysis of software applications to ensure they run optimally, detect incidents, and provide deep insights into system performance. Monitoring covers critical metrics such as:
- Response time
- Error rate
- Resource usage (CPU, RAM, Disk)
- Transaction performance
Application monitoring tools collect and analyze data to detect anomalies, alert on potential issues, and provide a complete view of application behavior. This allows teams to proactively resolve incidents, optimize performance, and improve user experience.
Jaeger - Distributed tracing tool
Jaeger is an open-source distributed tracing system developed by Uber, designed to track and troubleshoot complex microservices architectures.
Key features:
- Distributed request tracing
- Service dependency analysis
- Root cause identification
- OpenTracing support for easy integration
Example: Running Jaeger with Docker
| |
After installation, open Jaeger UI at http://localhost:16686.
References:
New Relic - Application performance monitoring
New Relic is a cloud observability platform that provides a comprehensive view of software and infrastructure. It supports real-time performance monitoring, data analysis, and automated alerts.
Key features:
- Application performance monitoring (APM)
- Log analysis and error tracing
- Web and mobile user experience monitoring
- AI-powered analytics for incident detection
Example: Installing New Relic Agent in Node.js
| |
Then add require('newrelic') at the top of your main file:
| |
References:
Datadog - Full-stack monitoring solution
Datadog is a monitoring and analytics platform for large-scale applications. It covers infrastructure monitoring, application performance, logs management, and user experience.
Key features:
- 400+ integrations with DevOps tools
- Unified dashboards for full system visibility
- Intelligent alerting
- Cloud-native monitoring support
Example: Installing Datadog Agent
| |
After installation, access the Datadog dashboard to view metrics.
References:
Conclusion
Application monitoring is crucial for ensuring system performance and reliability. Tools such as Jaeger, New Relic, and Datadog provide comprehensive solutions to track, analyze, and optimize software systems effectively. Choosing the right tool helps you manage applications better, detect issues early, and improve user experiences.
Deploy monitoring to optimize your application performance!
Next step: Learn about Artifacts in software development. Artifacts are the files or products produced during the development and deployment process.